


|
|
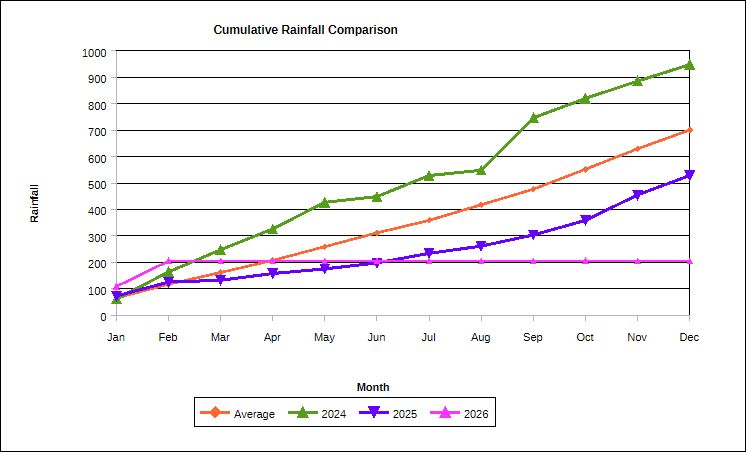
Average (33 years) |
2024 |
2025 |
2025 |
|
|
January |
65.5 |
61.8 |
73.0 |
109.2 |
|
|
February |
52.0 |
102.2 |
52.8 |
95.6 |
|
|
March |
44.5 |
83.6 |
6.6 |
|
|
|
April |
45.4 |
79.0 |
25.6 |
|
|
|
May |
51.8 |
100.4 |
17.6 |
|
|
|
June |
51.1 |
21.8 |
22.4 |
|
|
|
July |
46.3 |
79.4 |
36.2 |
|
|
|
August |
58.2 |
20.0 |
27.4 |
|
|
|
September |
57.2 |
197.8 |
42.2 |
|
|
|
October |
73.9 |
73.6 |
55.0 |
|
|
|
November |
74.3 |
65.4 |
96.2 |
|
|
|
December |
68.8 |
62.4 |
73.4 |
|
|
|
Total |
689.0 |
947.4 |
528.4 |
204.8 |
<year to date |