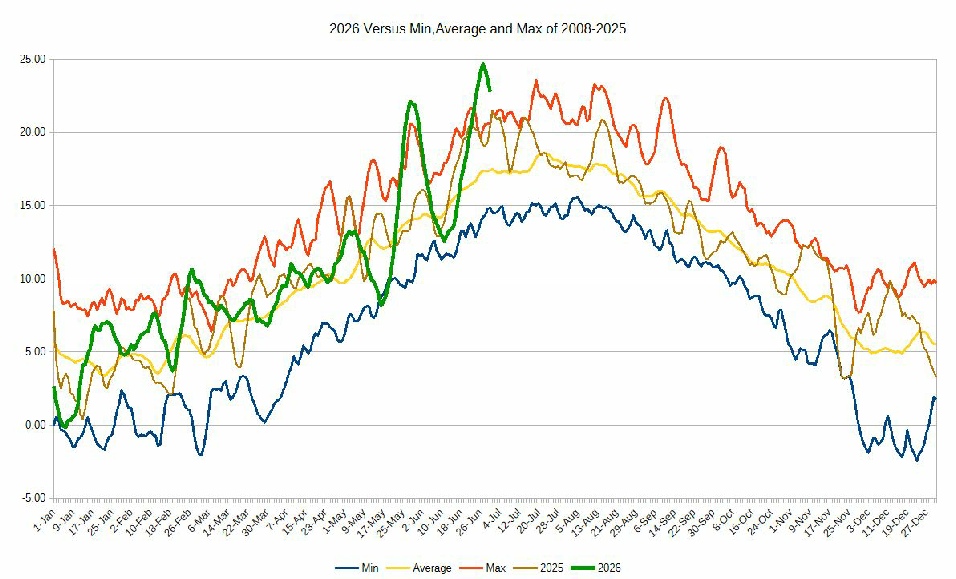
The graph shows the average daily temperatures for the current year versus the average daily minimum, average and maximum for the years 2008 to 2024.